Figure 2
Assessment and Correlation of Serum Urea and Creatinine Levels in Normal, Hypertensive, and Diabetic Persons in Auchi, Nigeria
Akpotaire PA and Seriki SA*
Published: 16 August, 2023 | Volume 7 - Issue 1 | Pages: 007-016

Figure 2:
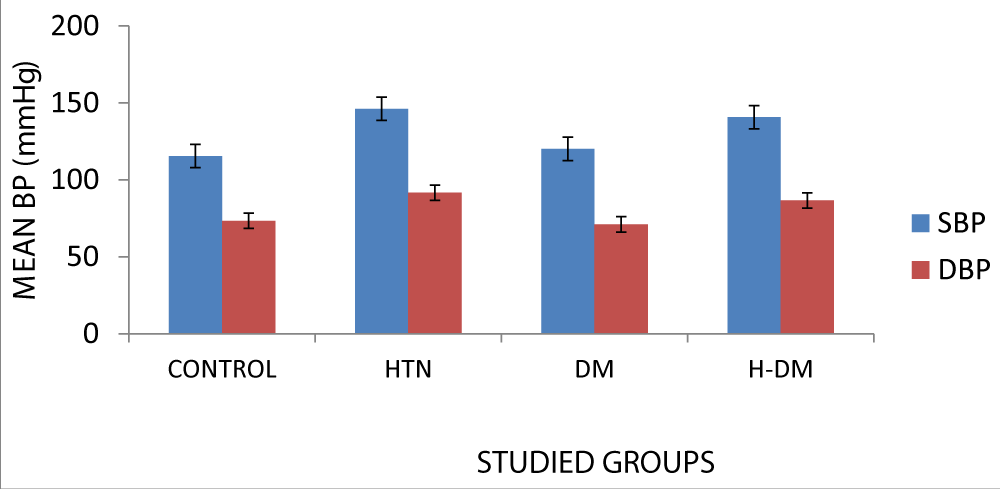
Figure 2: Comparison among study groups for blood pressure. H: Hypertensive, DM: Diabetic, H-DM: Hypertensive-diabetic. SBP: Systolic Blood Pressure, DBP: Diastolic Blood Pressure, BP: Blood Pressure
Read Full Article HTML DOI: 10.29328/journal.apcr.1001035 Cite this Article Read Full Article PDF
More Images
Similar Articles
-
Hypernatremia and central Diabetes Insipidus following Neurosurgical procedure of TraumaAwad Magbri*,Eussera El-Magbri,Seth Hershit. Hypernatremia and central Diabetes Insipidus following Neurosurgical procedure of Trauma . . 2017 doi: 10.29328/journal.hjpcr.1001002; 1: 005-008
-
Receptor pharmacology and other relevant factors in lower urinary tract pathology under a functional and toxicological approach: Instrument to better manage antimicrobials therapyMauro Luisetto*,Naseer Almukhtar,Behzad Nili-Ahmadabadi,Ghulam Rasool Mashori,Kausar Rehman Khan,Ram Kumar Sahu,Farhan Ahmad Khan,Gamal Abdul Hamid,Luca Cabianca. Receptor pharmacology and other relevant factors in lower urinary tract pathology under a functional and toxicological approach: Instrument to better manage antimicrobials therapy . . 2018 doi: 10.29328/journal.apcr.1001010; 2: 049-093
-
Assessment and Correlation of Serum Urea and Creatinine Levels in Normal, Hypertensive, and Diabetic Persons in Auchi, NigeriaAkpotaire PA, Seriki SA*. Assessment and Correlation of Serum Urea and Creatinine Levels in Normal, Hypertensive, and Diabetic Persons in Auchi, Nigeria. . 2023 doi: 10.29328/journal.apcr.1001035; 7: 007-016
-
A Perplexing Case of Genito-urinary Tuberculosis in an 83-Year-Old Woman with Increased Levels of Tumor Markers: A Case ReportVoskehat Mkrtumyan, Tamara Harutyunyan, Lilit Meliksetyan*, Armen Mkhitaryan, Parandzem Khachatryan. A Perplexing Case of Genito-urinary Tuberculosis in an 83-Year-Old Woman with Increased Levels of Tumor Markers: A Case Report. . 2023 doi: 10.29328/journal.apcr.1001038; 7: 028-033
Recently Viewed
-
Sex after Neurosurgery–Limitations, Recommendations, and the Impact on Patient’s Well-beingMor Levi Rivka*, Csaba L Dégi. Sex after Neurosurgery–Limitations, Recommendations, and the Impact on Patient’s Well-being. J Neurosci Neurol Disord. 2024: doi: 10.29328/journal.jnnd.1001099; 8: 064-068
-
The effect of NLP-based approach to teaching surgical procedures to senior OBGYN residentsMitra Ahmad Soltani,Jamileh Jahanbakhsh*,Zahra Takhty,Azarmindokht Shojai,Hengameh Sheikh. The effect of NLP-based approach to teaching surgical procedures to senior OBGYN residents. Clin J Obstet Gynecol. 2021: doi: 10.29328/journal.cjog.1001075; 4: 001-002
-
Unilateral pleural effusion as the sole presentation of ovarian hyperstimulation syndrome (OHSS)Tarique Salman*,Suruchi Mohan,Yasmin Sana. Unilateral pleural effusion as the sole presentation of ovarian hyperstimulation syndrome (OHSS). Clin J Obstet Gynecol. 2020: doi: 10.29328/journal.cjog.1001074; 3: 182-184
-
Chronic endometritis in in vitro fertilization failure patientsAfaf T Elnashar*,Mohamed Sabry. Chronic endometritis in in vitro fertilization failure patients. Clin J Obstet Gynecol. 2020: doi: 10.29328/journal.cjog.1001073; 3: 175-181
-
Relation of Arachnophobia with ABO blood group systemMuhammad Imran Qadir,Sani E Zahra*. Relation of Arachnophobia with ABO blood group system. J Hematol Clin Res. 2019: doi: 10.29328/journal.jhcr.1001011; 3: 050-052
Most Viewed
-
Evaluation of Biostimulants Based on Recovered Protein Hydrolysates from Animal By-products as Plant Growth EnhancersH Pérez-Aguilar*, M Lacruz-Asaro, F Arán-Ais. Evaluation of Biostimulants Based on Recovered Protein Hydrolysates from Animal By-products as Plant Growth Enhancers. J Plant Sci Phytopathol. 2023 doi: 10.29328/journal.jpsp.1001104; 7: 042-047
-
Sinonasal Myxoma Extending into the Orbit in a 4-Year Old: A Case PresentationJulian A Purrinos*, Ramzi Younis. Sinonasal Myxoma Extending into the Orbit in a 4-Year Old: A Case Presentation. Arch Case Rep. 2024 doi: 10.29328/journal.acr.1001099; 8: 075-077
-
Feasibility study of magnetic sensing for detecting single-neuron action potentialsDenis Tonini,Kai Wu,Renata Saha,Jian-Ping Wang*. Feasibility study of magnetic sensing for detecting single-neuron action potentials. Ann Biomed Sci Eng. 2022 doi: 10.29328/journal.abse.1001018; 6: 019-029
-
Pediatric Dysgerminoma: Unveiling a Rare Ovarian TumorFaten Limaiem*, Khalil Saffar, Ahmed Halouani. Pediatric Dysgerminoma: Unveiling a Rare Ovarian Tumor. Arch Case Rep. 2024 doi: 10.29328/journal.acr.1001087; 8: 010-013
-
Physical activity can change the physiological and psychological circumstances during COVID-19 pandemic: A narrative reviewKhashayar Maroufi*. Physical activity can change the physiological and psychological circumstances during COVID-19 pandemic: A narrative review. J Sports Med Ther. 2021 doi: 10.29328/journal.jsmt.1001051; 6: 001-007

HSPI: We're glad you're here. Please click "create a new Query" if you are a new visitor to our website and need further information from us.
If you are already a member of our network and need to keep track of any developments regarding a question you have already submitted, click "take me to my Query."


