Figure 3
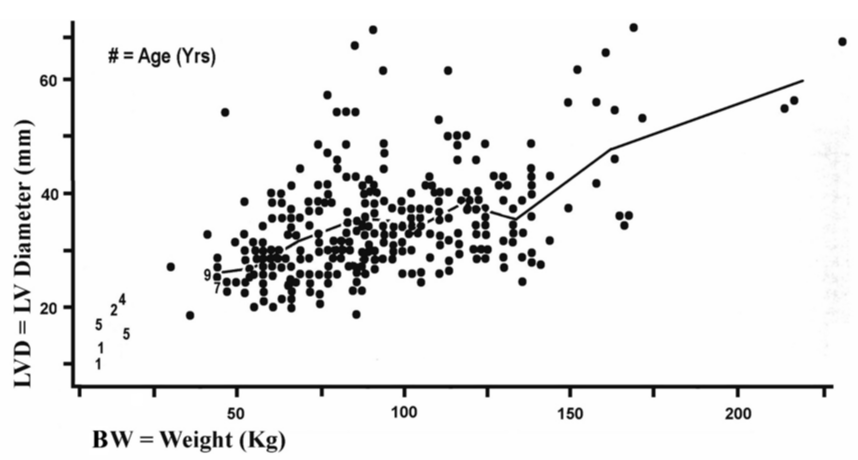
Longitudinal and transverse dimensions of hypertrophied cardiomyocytes in human left ventricle (LV) at autopsy; Heart failure might result from changes in chamber geometry without contractile weakening
Richard E Tracy*
Published: 23 July, 2019 | Volume 3 - Issue 1 | Pages: 015-019

Figure 3:
3: Index of longitudinal myocyte hypertrophy (LVD) is plotted by total body weight (BW). The line joining means of LVD within grouping intervals of BW (children noted by numerals are excluded) does not differ significantly from a sloping straight line. (r = .2539 among points and r = .2182 among means, ns p>.05.).
Read Full Article HTML DOI: 10.29328/journal.apcr.1001013 Cite this Article Read Full Article PDF
More Images
Similar Articles
-
Role of Carcinoma Associated Fibroblasts in Anoikis Resistance in Oral Squamous Cell Carcinoma –need of the hourAnjali Ganjre*. Role of Carcinoma Associated Fibroblasts in Anoikis Resistance in Oral Squamous Cell Carcinoma –need of the hour. . 2017 doi: 10.29328/journal.hjpcr.1001001; 1: 001-004
-
Hypernatremia and central Diabetes Insipidus following Neurosurgical procedure of TraumaAwad Magbri*,Eussera El-Magbri,Seth Hershit. Hypernatremia and central Diabetes Insipidus following Neurosurgical procedure of Trauma . . 2017 doi: 10.29328/journal.hjpcr.1001002; 1: 005-008
-
MicroRNA Therapeutics in Triple Negative Breast CancerSarmistha Mitra*. MicroRNA Therapeutics in Triple Negative Breast Cancer . . 2017 doi: 10.29328/journal.hjpcr.1001003; 1: 009-017
-
A great mimicker of Bone Secondaries: Brown Tumors, presenting with a Degenerative Lumber Disc like painZuhal Bayramoglu*,Ravza Yılmaz,Aysel Bayram. A great mimicker of Bone Secondaries: Brown Tumors, presenting with a Degenerative Lumber Disc like pain. . 2017 doi: 10.29328/journal.hjpcr.1001004; 1: 018-023
-
Predicament of classification: Multisystem small vessel vasculitis with cresentic GlomerulonephritisAwad Magbri*,Shaukat Rashid,Balhinder Brar . Predicament of classification: Multisystem small vessel vasculitis with cresentic Glomerulonephritis. . 2018 doi: 10.29328/journal.apcr.1001005; 2: 001-005
-
Pathological Effects of Cypermethrin on the Testes and Accessory Sexual Glands of Yankasa RamsUbah Simon*,Ogwu David,Rekwot Peter, Rwuaan Joseph,Chibuogwu Ijeoma, Njoku Celestine. Pathological Effects of Cypermethrin on the Testes and Accessory Sexual Glands of Yankasa Rams. . 2018 doi: 10.29328/journal.apcr.1001006; 2: 006-012
-
In at the deep end: Psychosocial aspects of developing autonomy in histopathology trainingAI Finall*. In at the deep end: Psychosocial aspects of developing autonomy in histopathology training. . 2018 doi: 10.29328/journal.apcr.1001007; 2: 013-019
-
Histological clonal change - A feature for dysplasia diagnosisLewei Zhang*,Tarinee Lubpairee,Denise M Laronde1, Martial Guillaud, Calum E MacAulay,Miriam P Rosin. Histological clonal change - A feature for dysplasia diagnosis. . 2018 doi: 10.29328/journal.apcr.1001008; 2: 020-028
-
Amyotropyc Lateral Sclerosis and Endogenous -Esogenous Toxicological Movens: New model to verify other Pharmacological StrategiesMauro Luisetto*,Behzad Nili-Ahmadabadi,Nilesh M Meghani,Ghulam Rasool Mashori,Ram Kumar Sahu,Kausar Rehman Khan, Ahmed Yesvi Rafa,Luca Cabianca,Gamal Abdul Hamid, Farhan Ahmad Khan. Amyotropyc Lateral Sclerosis and Endogenous -Esogenous Toxicological Movens: New model to verify other Pharmacological Strategies. . 2018 doi: 10.29328/journal.apcr.1001009; 2: 029-048
-
Receptor pharmacology and other relevant factors in lower urinary tract pathology under a functional and toxicological approach: Instrument to better manage antimicrobials therapyMauro Luisetto*,Naseer Almukhtar,Behzad Nili-Ahmadabadi,Ghulam Rasool Mashori,Kausar Rehman Khan,Ram Kumar Sahu,Farhan Ahmad Khan,Gamal Abdul Hamid,Luca Cabianca. Receptor pharmacology and other relevant factors in lower urinary tract pathology under a functional and toxicological approach: Instrument to better manage antimicrobials therapy . . 2018 doi: 10.29328/journal.apcr.1001010; 2: 049-093
Recently Viewed
-
An Interesting Autopsy Case Report of Acute Respiratory FailureJasleen Bhatia* and AK Das. An Interesting Autopsy Case Report of Acute Respiratory Failure. Arch Pathol Clin Res. 2023: doi: 10.29328/journal.apcr.1001036; 7: 017-019
-
In vitro, Anti-oxidant, and Anti-inflammatory Activity of Kalanchoe pinnataWijeratne Mudiyanselage Swarna Menu*. In vitro, Anti-oxidant, and Anti-inflammatory Activity of Kalanchoe pinnata. Arch Pharm Pharma Sci. 2025: doi: 10.29328/journal.apps.1001064; 9: 001-008
-
Green Synthesis of Citrus sinensis Peel (Orange Peel) Extract Silver Nanoparticle and its Various Pharmacological ActivitiesJ Bagyalakshmi,M Prathiksha. Green Synthesis of Citrus sinensis Peel (Orange Peel) Extract Silver Nanoparticle and its Various Pharmacological Activities. Arch Pharm Pharma Sci. 2025: doi: 10.29328/journal.apps.1001065; 9: 009-013
-
Unveiling the Impostor: Pulmonary Embolism Presenting as Pneumonia: A Case Report and Literature ReviewSaahil Kumar,Karuna Sree Alwa*,Mahesh Babu Vemuri,Anumola Gandhi Ganesh Gupta,Nuthan Vallapudasu,Sunitha Geddada. Unveiling the Impostor: Pulmonary Embolism Presenting as Pneumonia: A Case Report and Literature Review. J Pulmonol Respir Res. 2025: doi: 10.29328/journal.jprr.1001065; 9: 001-005
-
Dengue Epidemic during COVID-19 Pandemic: Clinical and Molecular Characterization – A Study from Western RajasthanPraveen Kumar Rathore,Eshank Gupta,Prabhu Prakash. Dengue Epidemic during COVID-19 Pandemic: Clinical and Molecular Characterization – A Study from Western Rajasthan. Int J Clin Virol. 2025: doi: 10.29328/journal.ijcv.1001063; 9: 005-009
Most Viewed
-
Evaluation of Biostimulants Based on Recovered Protein Hydrolysates from Animal By-products as Plant Growth EnhancersH Pérez-Aguilar*, M Lacruz-Asaro, F Arán-Ais. Evaluation of Biostimulants Based on Recovered Protein Hydrolysates from Animal By-products as Plant Growth Enhancers. J Plant Sci Phytopathol. 2023 doi: 10.29328/journal.jpsp.1001104; 7: 042-047
-
Sinonasal Myxoma Extending into the Orbit in a 4-Year Old: A Case PresentationJulian A Purrinos*, Ramzi Younis. Sinonasal Myxoma Extending into the Orbit in a 4-Year Old: A Case Presentation. Arch Case Rep. 2024 doi: 10.29328/journal.acr.1001099; 8: 075-077
-
Feasibility study of magnetic sensing for detecting single-neuron action potentialsDenis Tonini,Kai Wu,Renata Saha,Jian-Ping Wang*. Feasibility study of magnetic sensing for detecting single-neuron action potentials. Ann Biomed Sci Eng. 2022 doi: 10.29328/journal.abse.1001018; 6: 019-029
-
Pediatric Dysgerminoma: Unveiling a Rare Ovarian TumorFaten Limaiem*, Khalil Saffar, Ahmed Halouani. Pediatric Dysgerminoma: Unveiling a Rare Ovarian Tumor. Arch Case Rep. 2024 doi: 10.29328/journal.acr.1001087; 8: 010-013
-
Physical activity can change the physiological and psychological circumstances during COVID-19 pandemic: A narrative reviewKhashayar Maroufi*. Physical activity can change the physiological and psychological circumstances during COVID-19 pandemic: A narrative review. J Sports Med Ther. 2021 doi: 10.29328/journal.jsmt.1001051; 6: 001-007

HSPI: We're glad you're here. Please click "create a new Query" if you are a new visitor to our website and need further information from us.
If you are already a member of our network and need to keep track of any developments regarding a question you have already submitted, click "take me to my Query."


